
Capture the full request and response of failed Fluent Forms Pro webhook feeds and inspect them directly in the entry’s API Calls log.
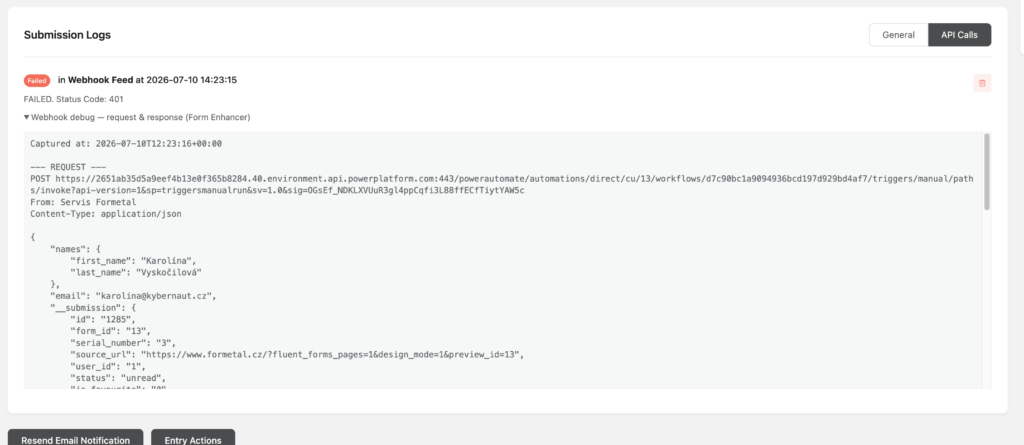
Fluent Forms itself only stores a short note like “FAILED. Status Code: 401” (truncated to ~254 characters), which tells you that a webhook failed but not why. The Webhook Debug Log records everything: the exact URL, method, headers, and body that were sent, and the status code, headers, and body that came back.

Use Cases
- Debugging authentication errors – See the exact
Authorizationheader that produced a 401/403. - Fixing payload mismatches – Compare what your form actually sent against what the receiving API expects (422 validation errors, wrong field names, wrong content type).
- Understanding endpoint errors – Read the full error response body from the remote service instead of a truncated fragment.
- Support tickets – Copy the complete request/response into a ticket for the receiving service’s support team.
How to Use
No configuration is needed — the feature is always on.
- When a webhook feed fails, open the entry under Fluent Forms → Entries
- Scroll to Submission Logs and switch to the API Calls tab
- The failed webhook row now includes a collapsible “Webhook debug — request & response (Form Enhancer)” section
- Expand it to see the full request (URL, method, headers, body) and response (status, headers, body); JSON bodies are pretty-printed
Key Features
Failures Only
Data is captured only when the webhook fails — a network error or an HTTP status of 300 and above (the same criteria Fluent Forms uses to mark the feed as failed). Successful calls are not stored.
Stored With the Entry
The captured data is saved as submission meta:
| Meta Key | Description |
|---|---|
formenhancer_webhook_debug_{action_id} | JSON with the full request and response of the failed webhook call |
- Deleting the entry deletes the debug data with it — no leftovers, no cleanup cron.
- Retrying/replaying the webhook overwrites the previous capture for that log row, so you always see the latest attempt.
- Request and response bodies are capped at 64 KB each; anything longer is truncated with a marker showing the original size.
Unmasked, Admin-Only Data
Headers and bodies are stored and displayed exactly as sent — including authentication headers — because that is usually what you need to see when debugging. The data is visible only to users who can access the Fluent Forms entry logs, and all output is HTML-escaped.
Disabling the Capture
There is no settings toggle; use the filter instead:
// Disable globally.
add_filter('formenhancer/webhook_debug_log', '__return_false');

// Disable for a specific form.
add_filter('formenhancer/webhook_debug_log', function ($enabled, $form, $feed) {
    return 42 === (int) $form->id ? false : $enabled;
}, 10, 3);
Notes
Requires Fluent Forms Pro for the webhook feed itself — the Webhook integration is a Fluent Forms Pro module. The capture works with both free and PRO versions of Form Enhancer.
Async webhooks only: the capture attaches to the scheduled action shown in the API Calls tab. Webhooks forced to run synchronously (via the fluentform/notifying_async_webhook filter) have no API Calls row and are skipped.
Sensitive data: since authentication headers are stored unmasked in the database, disable the capture via the filter if that is a concern in your environment.
Table of Contents